Within the scope of the LIFE EBP project Association Biom has been organising activities for collecting ornithological data since the 1st of February 2025. The aim of the project is to increase the quality and quantity of data collected in different countries of Southern and Southeastern Europe.
Since the project’s goals could never be reached without the help of the wider public, the aim of this report is to present the data collected from the 1st of February (beginning of the first data collection challenge) to the 11th of May (end of the second data collection challenge) in an informative and intuitive way to all those interested and involved with the project.
In the specified time period 11972 observations were collected throughout Croatia, making this report a way to express the Association’s gratitude towards everyone who invested their time and effort to collect ornithological data via the Naturalist app or the fauna.hr portal and thus helped to better understand the ornithofauna of Croatia.
A new way to collect data
One of the main activities of the LIFE EBP project is ensuring a more equal representation of ornithological observations across Europe. Despite the fact that 9% of Europe’s population lives in the project area of Southern and Southeastern Europe their contribution amounts to less than 2% of all ornithological data in Europe. In addition, data from these regions are mostly observed without a protocol (sporadic data). Even though sporadic, or incomplete data, is still useful for understanding the ornithofauna of a given area it shows only a brief glimpse of the actual field conditions. By collecting sporadic data only species presence data is collected, completely omitting all of the species which aren’t present at the site. This in turn makes it very difficult to study the distribution and migration of birds.
Data collected by using protocols, or complete data, offer a more detailed view of the presence and absence of species, as well as the time spent collecting said data. Complete lists are one of the simplest protocols for collecting complete data. Simply put, these are lists of all birds present at a given place within a given period of time. LIFE EBP’s goal of ensuring that more data is collected is closely followed by the goal to increase the quality of data by increasing the number of complete lists.
Complete lists have been collected in Croatia since 2017., when the fauna.hr portal was launched. As shown on Figure 1., several thousands of observations are collected during the period between 1.2. and 11.5. The same period was marked with the beginning of data collection in Croatia which is clearly shown by the last column of figure.
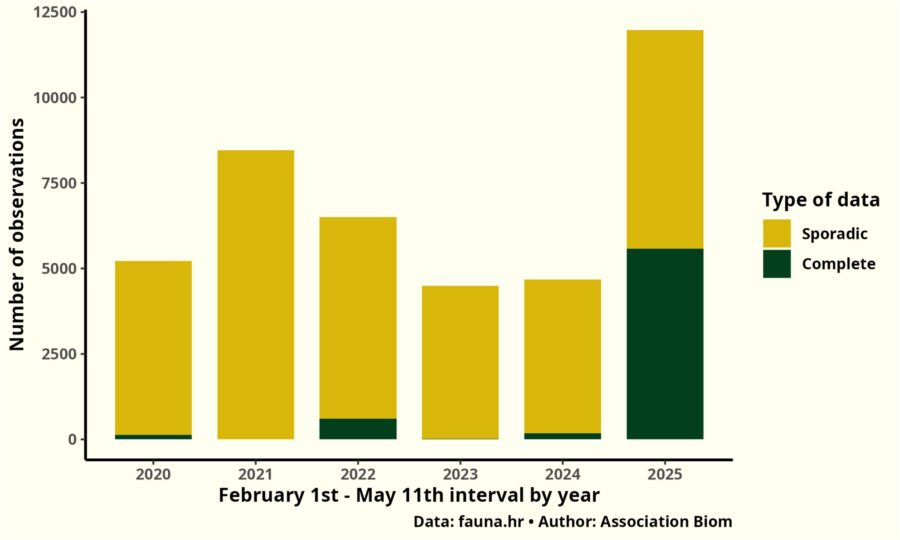
Figure 1. Total number of ornithological data collected via the portal fauna.hr with the ratio of complete and sporadic data, shown by year for the period of February 1st to May 11th.
A total of 11927 observations were collected during the period in 2025., which is far more than any other year of the current decade. Observations collected within complete lists accounted for 47% of the data, outnumbering all data collected in the same period of 2020., 2023. and 2024.
The weekly influx of data shows a similar trend on Figure 2. Starting with the fifth and ending with the nineteenth week of the year (the observed three-month period), the current year shows a larger number of collected data for almost every week. Only one week had less data collected than in the previous years and only four of fifteen weeks in 2025. had a number of observations lower than the average for the same period of the last three years.
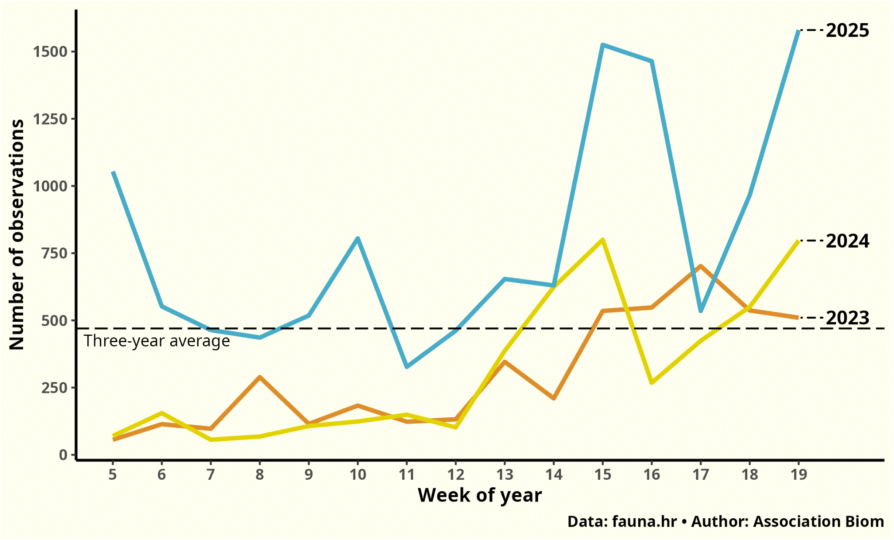
Figure 2. Weekly number of ornithological observations collected via the fauna.hr portal for the last three years, shown for the period of February 1st to May 11th. The horizontal line shows the average of weekly data for the observed years and the specified period.
It comes as no surprise that the fifth and nineteenth weekend of 2025., both weeks in which data collection challenges were held, stick out as especially productive. During the first two challenges a total of 1007 observations (75% of which were complete) and 1256 observations (62% of which were complete) were collected. These insights would be impossible to get by without the time and effort of diligent field observers; 23 people were involved in the first challenge and 10 in the second. Taking a closer look at the way users enter data offers a much better understanding of the way data is collected.
The number of users and their activity
Despite the successful efforts to increase the number of complete observations in 2025. Figure 3. shows that sporadic data is still the most popular mode of data collection in Croatia.
February has been the month with the most active users entering complete data, peaking at 23. Since then the number has gone down considerably while the number of complete data has stayed relatively high. March is a great example of this, with 1368 observations being contributed by just nine uses! This also means that just nine users contributed over 50% of the data that month!
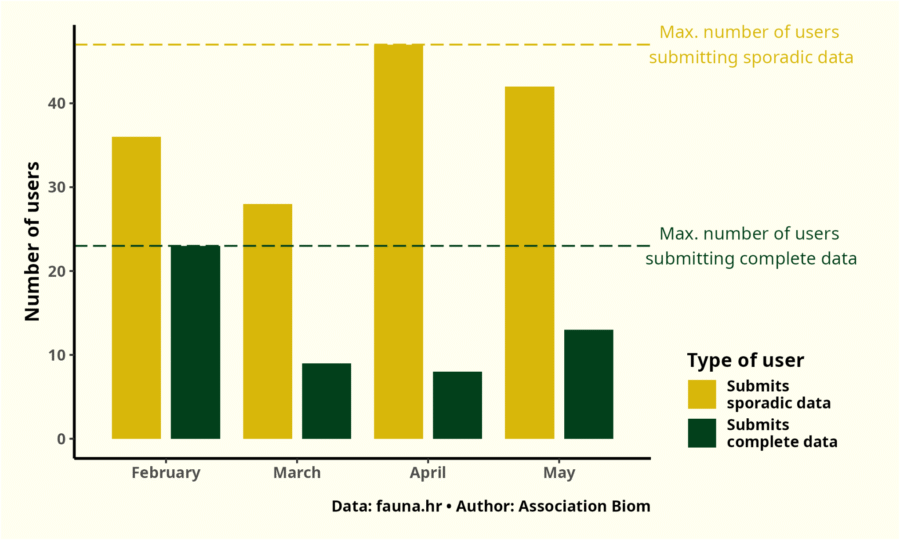
Figure 3. Monthly number of users collecting ornithological observations via the fauna.hr portal, divided by the type of data they collected. The green and yellow horizontal lines show the number of users submitting sporadic and complete observations, respectively.
Most popular time of the day for collecting observations: between 6 and 10 in the morning.
Most popular day of the week for collecting observations: Sunday.
Total duration of complete lists: 305 hours (equivalent to 12 days and 17 hours or 135 Matrix (1999) movies, or 103 director’s cut Fellowship’s of the Ring)
Average duration of a complete list: 72 minutes.
Birdwatching throughout Croatia
The amount and type of data differed greatly within the 14 counties in which users collected observations. Figure 4. shows a ranking of counties by total observation number with a ratio of complete and sporadic data. Since the number of overall users is relatively small, in many cases the dominant data type depends on the activity of just a few, or even a single user.
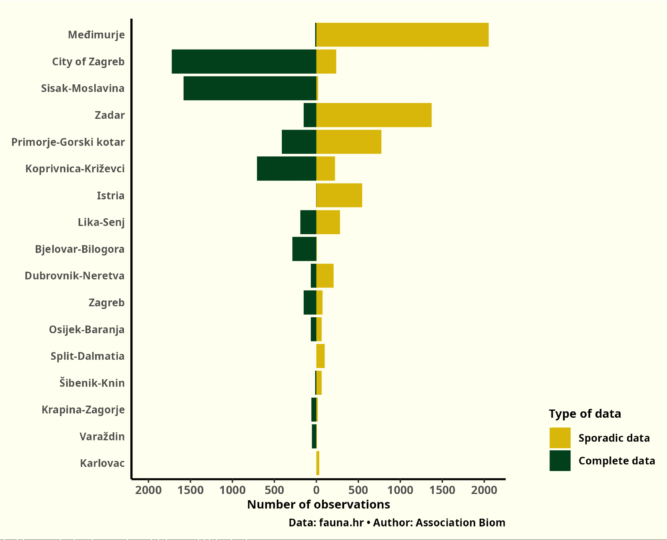
Figure 4. Total number of ornithological observations collected via the fauna.hr portal from February 1st to May 11th 2025., shown by county and distinguished by the type of observations.
Međimurje county boasts the highest number of observations but is a prime example of a large amount of data coming from a single source. In fact, over 95% of data was collected by a single user! The distribution and number of observations are shown on Figure 5. Despite a low number of users the county has a rather even distribution of observations, with the most coming from its centre.
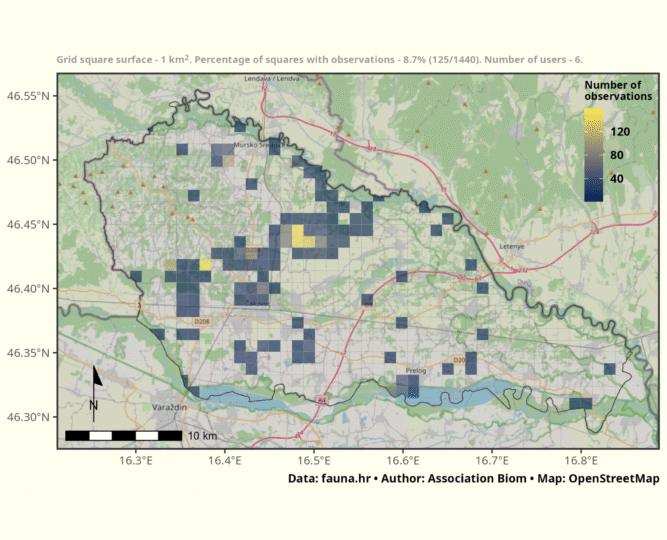
Figure 5. Međimurje county divided by a square grid with cell size 1 km2, coloured by the amount of ornithological observations collected via the fauna.hr portal from February 1st to May 11th 2025.
The City of Zagreb, as shown on Figure 6., is a close second when it comes to the amount of data and even though it has a much larger number of observers (26), a smaller percentage of grid cells have registered an observation. It seems that many of Zagreb’s users are very active since no user amounts to more than 30% of all data. The most popular birding spots are the centre of the city, the Sava river’s banks, Rakitje lakes and Bundek.
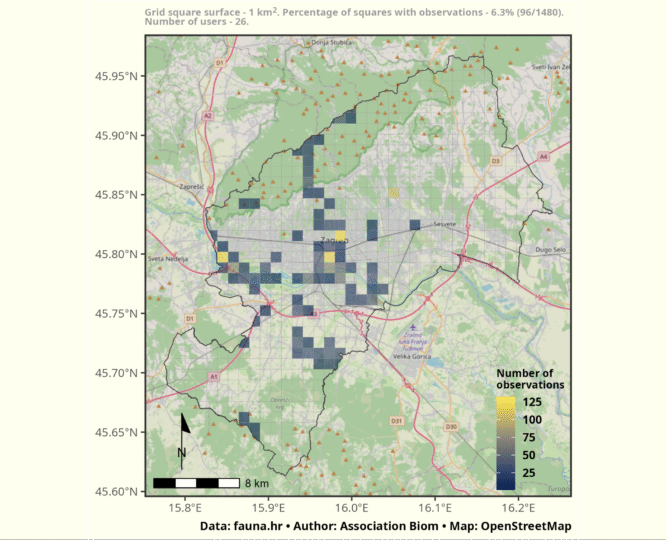
Figure 6. The city of Zagreb divided by a square grid with cell size 1 km2, coloured by the amount of ornithological observations collected via the fauna.hr portal from February 1st to May 11th 2025.
The third county by number of observations is Sisak-Moslavina county, which is in a way very similar to Međimurje. From the seven observers active in this county, just one of them has collected 95% of all data. Figure 7. shows the centralised nature of data collection in this county, with most data coming from the broader area of Sisak.
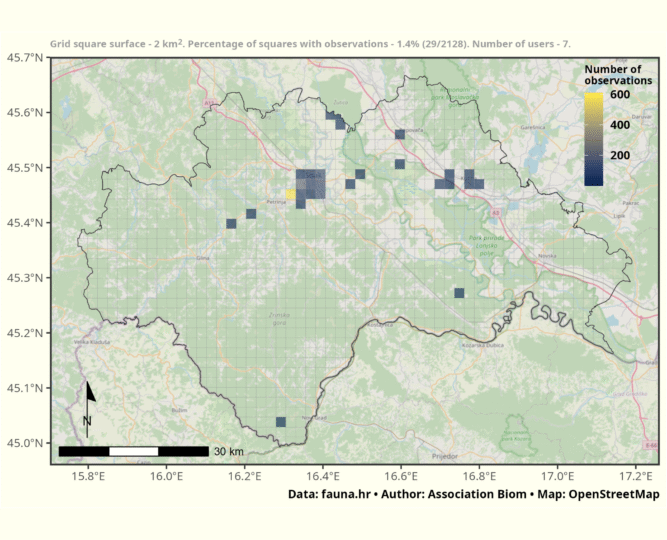
Figure 7. Sisak-Moslavina county divided by a square grid with cell size 2 km2, coloured by the amount of ornithological observations collected via the fauna.hr portal from February 1st to May 11th 2025.
Species diversity
In about three months a total of 282 species were observed, 25 of which were represented by more than 100 observations, whereas 176 species were observed less than five times. The large number of species scarcely present in the dataset could be attributed to a large number of observers being based in urban areas, for which there’s some proof in the maps shown previously.
The list of the 20 most observed birds is dominated by urban species – hooded crow, blackbird, great tit, chaffinch and blackcap (Figure 8.), species which can be observed in many city parks. However, these generalist species can be found in many different environments throughout the year. Having such a large number of observations of common species is a welcome result in a project run under the motto “Every bird counts”. Furthermore, it presents a broader understanding of the value of collecting data on common species.
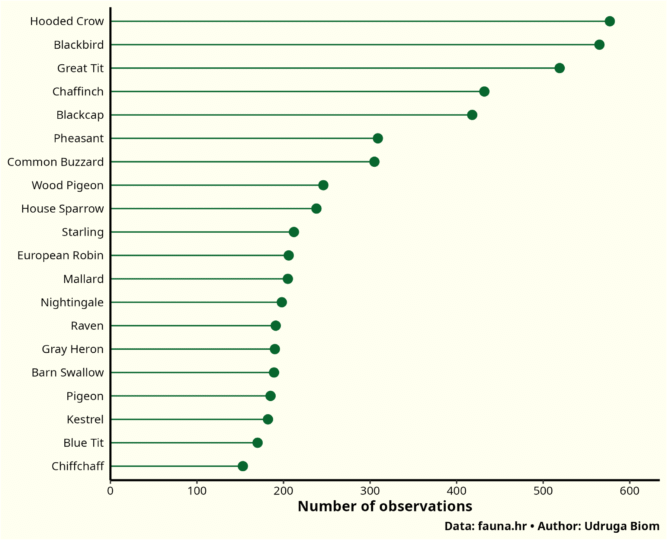
Figure 8. Number of observations for the twenty most observed species via the fauna.hr portal between February 1st and May 11th of 2025.
The results of ornithological data collection from the first trimester of the project clearly show the importance of volunteer contributions in understanding and conserving nature. Almost twelve thousand observations were collected in just three months with a notable increase in the collection of complete data, a key goal for enabling scientific analysis of the data. Even though the number of users is still relatively small their dedication and effort bring forth remarkable results. These observations offer valuable insights in the distribution of birds in Croatia and make better nature conservation possible. The continuation of this trend in the future could aid the ongoing national and European conservation efforts.