The past eight years were the warmest years on record. The global average annual concentration of carbon dioxide (CO2) and methane (CH4) reached their highest levels ever measured by satellites in 2022. It was the warmest summer in Europe
The Copernicus Climate Change Service published its annual report, the European State of the Climate (ESOTC), with the details on significant climate events of 2022 in Europe and across the world. These insights based on the collected data show increasing temperatures and the growing intensification of extreme events, as well as give oversight of the climate in 2022 in a long-term context.
Globally, the past eight years were the warmest years on record. The global average annual concentration of carbon dioxide (CO2) and methane (CH4) reached their highest levels ever measured by satellites in 2022. It was the warmest summer in Europe, with several extreme events, including intense heat waves, droughts, and wildfires, according to the data presented by the Copernicus Climate Change Service (C3S). Throughout Europe, the annual average temperatures are doubling, faster than on any other continent.
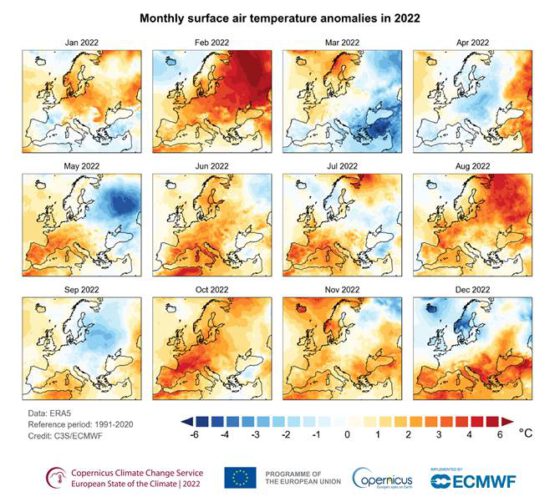
The growing temperature is an important climate indicator, and it points to climate changes in Europe. The data shows that the European average in the last five years was around 2,2°C above the preindustrial average (1850-1900). Moreover, 2022 was the second warmest year on record, with 0,9°C above the recent average (the reference period being that of 1991-2020). Last summer was the warmest summer recorded in Europe, with 1,4°C above the recent average.
A record number of days with ‘very strong heat stress’
Extreme heats during late-spring and summer resulted in conditions that were dangerous for human health. Due to the extreme heat waves during summer, Southern Europe experienced a record number of days with ‘very strong heat stress’. There is an upward trend in Europe in the number of summer days with ‘strong’ or ‘very strong heat stress’, while in Southern Europe the trend is for ‘extreme heat stress’. There is also a decreasing trend in the number of days with ‘no heat stress’.
Carlo Buontempo, Director of the Copernicus Climate Change Service (C3S) commented: “The report highlights alarming changes to our climate, including the hottest summer ever recorded in Europe, marked by unprecedented marine heat waves in the Mediterranean Sea and record-breaking temperatures in Greenland. Understanding the climate dynamics in Europe is crucial for our efforts to adapt and mitigate the negative impacts climate change has on the continent.”
The increasing temperatures in Europe are part of an upward trend that has been happening worldwide in the past decades. The World Meteorological Organisation (WMO) will address these global climate trends in its upcoming report State of the Global Climate 2022.
Long-term drought
One of the most significant events that affected Europe was a widespread drought. During the winter of 2021-2022, the bigger part of Europe experienced fewer snow days than average, with many areas had up to 30 fewer snow days. In spring, the precipitation was below average in most parts of the continent, and May had the largest below-average precipitation ever recorded. The lack of winter snow and high summer temperatures resulted in a record loss of ice from glaciers in the Alps, which amounted to a loss of more than 5 km3 of ice. Low precipitation, which continued throughout the summer, along with extreme heat waves, also caused a widespread and long-term drought which affected several sectors, such as agriculture, inland waterway traffic, and energy industry.
The annual soil moisture anomaly was the second lowest in the past 50 years, with only isolated areas having above-average soil moisture. Furthermore, the river flow in Europe was the second lowest ever recorded in history, which marks the sixth year in a row with a below-average flow. With regards to the area affected, 2022 was the driest year on record, with 63% of European rivers with a below-average flow.
Image of river anomalies:
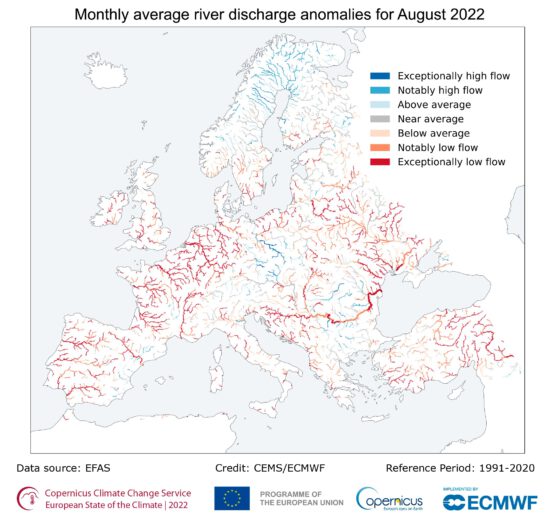
The monthly average of river flow anomalies for August 2022. Categories: “exceptionally high (low)”, “notably high (low)”, “above (below) average” and “near average” refer to percentile ranges >90 (<10), 75–90 (10–25), 60–75 (25–40), and 40–60 for the reference period of 1991-2020. Shades of blue represent a flow higher than average, while shades of red represent a flow lower than average. The grey represents a nearly average flow. Only rivers with a drainage area larger than 1,000 km2 are shown. Data source: EFAS. Credit: Copernicus EMS/ECMWF.